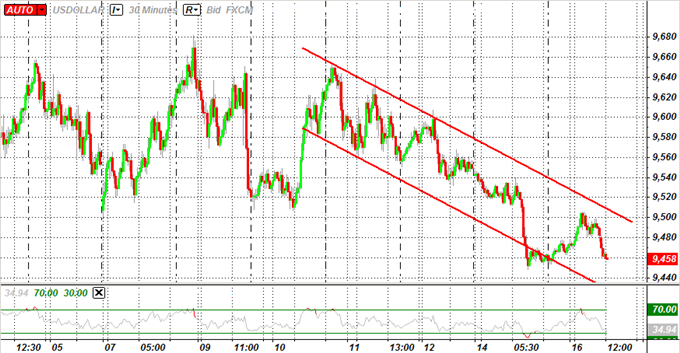
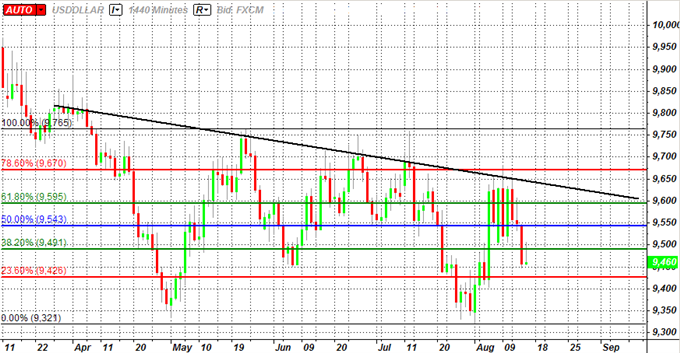
C-GB

C-GB
C-GB Algo Hedge Fund,with the Best Pamm Account Managers,a pure systematic (automated) trading program which is quite different than most as it utilizes sophisticated algorithms , our Fund provides exceptional strength, and stability. Trading Forex, CFD's Gold,Oil,Futures, New Clients Receive Free Start-up Capital -No Catches No Risk- Invest in C-GB Algo Hedge Fund open an Account in Minutes Below.

Wednesday, August 31, 2011

USD/CAD technical analysis for August 31, 2011


Georgi Navrusbeckov
Technical analysis
Recently the price has been demonstrating downside movement despite the fact that it managed to decline by almost 120 pips in 8 days. Current resistance for the price is the 50.0 long-term Fibonacci correction level.

Basic signal to open short positions was received two days ago from the MACD indicator. The signal was quite strong, however we are about to receive the opposite signal from another oscillator. The Stochastic oscillator might get oversold soon. At the moment the line is pretty close to the control level 20. An exit from this level will be a buy signal.

EUR/JPY Intraday Technical analysis 2011-08-31

Technical analysis


The spot rate is currently testing the lower limit of its medium-term bullish channel in 110.50 suggesting a rebound. However a break of these levels would initiate a new trend.
According to previous events, the market indicates a bullish opportunity on the levels of 110.50 with a 1st objective of 111.20, then 111.50. A break in 110.30 would invalidate this scenario.

Tuesday, August 30, 2011

Fed doesn't anticipate an economic contraction. Expects to consider the costs/benefits of 'various potential tools' in Sept meeting.

US Dollar falling off, risk rallying as Fed struck very dovish note seen through minutes.
FOMC Minutes Weighing Heavily on the greenback here. . . Dollar Losses Accelerate. . .
FOMC to consider costs, benefits of 'Various Potential Tools' . . . .
U.S. stock market little increased after FOMC minutes release. S&P 500 rose 0.1% to 1211.3, DJIA was up 0.14% to 11556.

EUR/USD Intraday Technical analysis 2011-08-30

The spot rate approaches the upper limit of its medium-term bullish channel in 1.4570 suggesting a decline. However a break of these levels would initiate a bullish trend more violent.
According to previous events, the market indicates a bullish opportunity as soon as the spot rate will have broken its resistance in 1.4570 with a 1st objective of 1.4690, then 1.4720. A break in 1.4540 would invalidate this scenario.

Friday, August 26, 2011

Technical Analysis and Trading Recommendations for EUR/USD. A Weekly Review.

Intraday timeframe
Ishimoku:
The situation with the euro is ambiguous at this chart as the Buy signal has been formed but the Bollinger Bands are showing a lack of trend. This signal is confirmed as the Chinkou Span is above the price curve and the signal is strong because the price is above the Ishimoku cloud. That is why it is not recommended to trade long on the day timeframe, for starting long positions it is necessary to wait for the Bollinger Bands’ divergence upwards. In this case the first target of the rising motion will be the first resistance level 1.4705. If this level is passed then the next target will be the second resistance level at 1.5013. If the price fixates below Kijun-sen (1.4295), Buy signal will weaken and this will be the signal to narrow long trades. The price is below the lines of Tenkan-sen and Kijun-sen which shows a rising sentiment. I do not recommend to think of short trading before the formation of Sell signal. Tenkan-sen is directed upwards, which denotes a rise in short-term period. Kijun-sen is also directed upside which shows that in a long-term outlook a rising trend will continue. The Chinkou Spanis above the price curve which confirms the Buy signal and demonstrates bullish sentiment of the market. The Ishimoku cloud confirms the continuation of a climbing movement as it is diverging and directed upwards.
Bollinger Bands:
This indicator shows movement in the sideways as the Bollinger Bands are not expanding and directed sideways. That is why now forming of false signals by Ishimoku is also possible, and before the confirmation of every signal and before the beginning of the bands’ divergence it is not advised to trade.

MACD:

This indicator is directed upwards showing the current ascend within the sideways channel. So currently trading is not recommended. In case of a trend move starting it is advised to open long trades only when the MACD is directed upside.
Trading recommendations:
EUR/USD is in the sideways and long trade can be opened only in case the Bollinger Bands start to diverge. Then the target will be the first resistance level 1.4705, and if this level is passed – 1.5013. Stop loss should be placed below 1.4295. Also for starting long trade the MACD should be directed upwards.

The chart annotation:
Ishimoku indicator:
Tenkan-sen — red line
Kijun-sen — blue line
Senkou Span A — light brown stipple line
Senkou Span B — light purple stipple line
Chinkou Span — green line
Bollinger Bands indicator:
3 yellow lines
MACD indicator:
The red line and the histogram with the white bars in the indicators window.

Thursday, August 25, 2011

Forex Market Time Converter

Time Zone:
Time and date: 12:58 AM 26-August-2011 GMT
Click on a time zone for Daylight Saving Time (DST) transition dates and times.
Forex Market CenterTime ZoneOpens
GMT
Closes
GMT
Status
Frankfurt
Germany
06:00 AM
26-August-2011
02:00 PM
26-August-2011
Closed
London
Great Britain
07:00 AM
26-August-2011
03:00 PM
26-August-2011
Closed
New York
United States
America/New_York12:00 PM
26-August-2011
08:00 PM
26-August-2011
Closed
Sydney
Austrailia
Australia/Sydney10:00 PM
25-August-2011
06:00 AM
26-August-2011
Open
Tokyo
Japan
11:00 PM
25-August-2011
07:00 AM
26-August-2011
Open
Refresh page every minutes
(set refresh to 0 to turn off refresh)
The Forex Market Hours Converter assumes local "wall clock" trading hours of 8:00 AM - 4:00 PM in each Forex market. Holidays not included. Not intended for use as an accurate time source. If you need the precise time, see http://www.time.gov/. Please send questions, comments, or suggestions to webmaster@timezoneconverter.com.


How to use the Forex Market Time Converter

The forex market is available for trading 24 hours a day, five and one-half days per week. The Forex Market Time Converter displays "Open" or "Closed" in the Status column to indicate the current state of each global Market Center. However, just because you can trade the market any time of the day or night doesn't necessarily mean that you should. Most successful day traders understand that more trades are successful if conducted when market activity is high and that it is best to avoid times when trading is light.
Here are some tips for using the Forex Market Time Converter:
  • Concentrate your trading activity during the trading hours for the three largest Market Centers: London, New_York, and Tokyo.

  • Most market activity will occur when one of these three markets open.

  • Some of the most active market times will occur when two or more Market Centers are open at the same time. The Forex Market Time Converter will clearly indicate when two or more markets are open by displaying multiple green "Open" indicators in the Status column.

  • About The Forex Time Zone Converter

  • The foreign exchange ("forex" or "FX") currency market is not traded on a regulated exchange like stocks and commodities. Rather, the market consists of a network of financial institutions and retail trading brokers which each have their own individual hours of operation. Since most participants trade between the hours of 8:00 a.m. and 4:00 p.m. in their local time zone, these times are used as the market open and close times, respectively.

FOREX Session Time Zones, Forex Trading Hours in Your Area.

At about 5pm New York time Sunday afternoon the Tokyo/Asian session opens and FOREX trading starts non-stop going into the European trading session at about 3am EST and then on to the American session at 8am EST time until it makes full circle back to the Asian trading session never stopping, trading over a TRILLION and a half dollars every single trading day.
Actually the Federal Reserve has an even better description of the FOREX Time zones...
"Somewhere on the planet, financial centers are open for business, and banks and other institutions are trading the dollar and other currencies, every hour of the day and night, aside from possible minor gaps on weekends. In financial centers around the world, business hours overlap; as some centers close, others open and begin to trade. The foreign exchange market follows the sun around the earth.
The International Date Line is located in the western Pacific, and each business day arrives first in the Asia-Pacific financial centers— first Wellington, New Zealand, then Sydney, Australia, followed by Tokyo, Hong Kong, and Singapore. A few hours later, while markets remain active in those Asian centers, trading begins in Bahrain and elsewhere in the Middle East. Later still, when it is late in the business day in Tokyo, markets in Europe open for business. Subsequently, when it is early afternoon in Europe, trading in New York and other U.S. centers starts. Finally, completing the circle, when it is mid- or late-afternoon in the United States, the next day has arrived in the Asia-Pacific area, the first markets there have opened, and the process begins again." – Sam Cross – Federal Reserve Bank
The FOREX trading hours charts below are based on the twenty four hour clock. To determine which session is currently trading, use the chart for the area in which you live and remember the times are approximate.
Forex Trading Hours Asian

FOREX trading Hours London

Forex Trading Hours New York

GBP/JPY Elliott wave count and Fibonacci levels for August 25, 201

GBP/JPY is developing impulse wave С (colored royal blue in the chart) of medium term downtrend from 127.31. The targets of the downmove are Fibonacci retracements of 123.27-127.31, and expansions off 130.81-123.27-127.31, 127.31-126.15-126.95, 126.95-125.61-126.28.
Supports:
- 125.45 = contracted objective point (COP)
- 125.29 = .50 retracement
- 125.07 = expanded objective point (XOP)
- 124.94 = objective point (OP)
- 124.81 = .618 ret
- 124.11 = XOP
- etc.
If the price reverses to the upnside the immediate resistances will be Fibonacci retracements of 130.81-123.27, and expansions off 123.27-127.31-125.61.
Resistances:
- 127.93 = .618 ret
- 128.11 = COP
- 129.65 = OP
Overbought/Oversold
Assuming that the major wave is down it's preferable to try short positions when the Detrended Oscillator gets above the zero level (current prices) or into the overbought area (10-20 pips above the current prices).

Wednesday, August 24, 2011

Intraday Trade. EUR/USD for August 24, 2011. Technical Analysis � ZUP & APL`s.

EUR/USD h1
Wave Level Minuette

The price of EUR/USD currently is between the levels 1.4396 1/2ML of pitchfork BY Minuette and 1.4427 of the initial line of the pitchfork BY Minuette. The direction of the further movement of the pair today will be determined by the direction of this range’s breakthrough, and the options of the further events can be as follows:
- the puncture of the resistance of the initial line of the pitchfork BY Minuette at 1.4427 can cause an attempt to renew the yesterday’s high at 1.4502 and to continue the motion to the laval of 1.4522 at the previous live UWL38.2 of the pitchfork BY Minuette, the break through which will direct the price to the resistance level of 1.4579, which was formed by the crossing of the warning line UWL61.8 and of the control line UTL of the pitchfork BY Minuette;
- breaking of the support level at 1.4396 by 1/2ML will direct the price to the lower limit of the range 1/2ML of the pitchfork BY Minuette and to the level of 1.4348, a puncture of these levels and fixation of the price below the limits of the range 1/2ML of the pitchfork BY Minuette will give an opportunity to speak about the target of the price motion of EUR/USD to the support level at 1.4236 at the crossing of the lower limit of the zone of equilibrium of the dynamic pitchfork BY Minuette with the upper limit of the equilibrium zone of the static pitchfork BY Minuette, and further with the puncture of 1.4236 the further movement of the pair will be happening within the limits of the euiqlibrium zone of the pitchfork BY Minuette 1.4236 <-> 1.4177 <-> 1.4118.

EUR/USD m15 & m5
Wave levels Micro and SubMicro

Detalization of support and resistance levels in lower operational scales
  

Tuesday, August 23, 2011

EUR/USD Wave Analysis for August 23, 2011

Yesterday EUR/USD was trading within a narrow price range during the whole day between the correction levels of 23.6 and 38.2%. Thus, if the situation develops by the correction scenario it will be possible to assume that the price is forming a wave structure of the wave b in this correction. Meanwhile, after finishing of this b the euro may continue the decline to the 43rd figure or to the correction level 76.4%. At the same time, considering a difficult situation on the markets the renewal of the increasing movement should not be excluded, possibly from the current euro prices.

Monday, August 22, 2011

New partnership program by InstaForex: SUB IB

SUB IB InstaForexInternational broker InstaForex is glad to launch a new two-level partnership program – Sub Introducing Broker (SUB IB). Now the terms of cooperation with InstaForex are even more beneficial!

SUB IB partnership program allows every partner of InstaForex Company to receive 0.1 pip reward from every deal of subpartners’ clients. Subpartners are new partners who registered for the partnership program using the link of a company’s partner. It means that after a subpartner registers for the partnership program using the affiliate link, the owner of the link will automatically gain 0.1 pip from the deals of subpartner’s clients.

Reward is automatically credited to the affiliate account according to the following principle:
1) up to 10 dollars per day from one partner;
2) up to 200 dollars per month from one partner.

We would like to draw your attention to the fact that the reward for deals of clients registered under a subpartner is credited only from a registered participant of SUB IB partnership program. Clients of subpartners who are not registered in this type of partnership program will not bring anything to the partners. In order to get the statistics on your subpartners and, consequently, your commission from deals of their clients, please contact out Partner Relations Department.

Thus, InstaForex again proved that it strives to provide its partners with maximum opportunities of taking profit. The new two-level partnership program by InstaForex comprises the high reward of 1.5-2 pips (and up to 10 pips on GOLD) from every deal of a client and additional 0.1 pip from deals of subpartners’ clients.

InstaForex: all the best for partners

USD/JPY Weekly Forecast For August 22nd - 26th / 2011

SHORT  DESCRIPTION :

The USD/JPY pair is still in the Bearish situation, this all is vivid by the slope of the moving average 10-day period that is still swoop to downwards and by the candlestick which are still below the moving average and the RSI - under the level 40. If next week the USD/JPY succeeds to breakdown and close below the 75.19 level; the mark 73.00 can become the next target for this currency. However, if the USD/JPY turns up to the 76.97 level, then this will hold the weakening of the USD; at least temporarily.

Friday, August 19, 2011

AUD/USD wave analysis for August 19, 2011

The AUD/USD pair is forming a potential impulse wave C of the 4th order of the downside medium-term trend from 1.0600.Break of wave A top 0.9928 will prove this wave. In the meantime, nearest supports will be calculated according to the correction net 0.9928-1.0600 and extension net 1.1079-0.9928-1.0600.

Closest supports:
- 1.0624 = correction 50%
- 1.0185 = 61.8%
- 0.9889 = extension 61.8%
If the upside movement resumes the nearest support levels will be provided by the correction nets 1.1079-0.9928, as well as extension nets 0.9928-1.0600-1.0320.
Resistances:
- 1.0639= correction 61.8%
- 1.0735 = extension 61.8%
Deal direction – SELL
Wave levels (annotation):

1st order – dotted line
2nd, 3rd order and higher – line width 1, 2 etc.
The same scheme is employed for Fibonacci nets and line regression channels

Thursday, August 18, 2011

EUR/USD Intraday Technical Level For August 18th / 2011

TODAY  TECHNICAL  LEVEL :

Breakout BUY Level : 1.4501.
Strong Resistance : 1.4493.
Original Resistance : 1.4479.
Inner Sell Area : 1.4465.
Target Inner Area : 1.4431.
Inner Buy Area : 1.4397.
Original Support : 1.4383.
Strong Support : 1.4369.
Breakout SELL Level : 1.4360.

SHORT  DESCRIPTION :

Today the EUR/USD is to find Support and Resistance between 1.4383 and 1.4479 and it has a strong Support at 1.4369 and a strong Resistance at 1.4493; if today the EUR/USD can breakout and closes below 1.4360, it will be a sign for Short trading for today; on the other hand, if the pair can break out and close above 1.4501, it will be the sign for LONG trading for today. Another option for the advanced trader can be trading between the Inner Buy Level at the 1.4397 for LONG trading and the Inner Sell Level at the 1.4465 for the SHORT trading, and all of them with the target at the 1.4431 level.
 http://instaforex.com/forex_analysis/36244/?x=OUE 

Wednesday, August 17, 2011

USD/JPY Intraday Technical analysis 2011-08-17

The spot rate is currently testing the lower limit of its medium-term bullish channel in 76.70 suggesting a rebound. However a break of these levels would initiate a new trend.
According to previous events, the market indicates a bullish opportunity on the levels of 76.70 with a 1st objective of 77.20, then 77.50. A break in 76.50 would invalidate this scenario.

Tuesday, August 16, 2011

U.S. Dollar Index Searches For Support, Sterling Weakness Ahead

U.S._Dollar_Index_Searches_For_Support_Sterling_Weakness_Ahead_body_ScreenShot049.png, U.S. Dollar Index Searches For Support, Sterling Weakness Ahead
The U.S. dollar struggled to hold its ground during the North American session and the greenback may trade heavy over the near-term as the Federal Reserve maintains a cautious outlook for the world’s largest economy. The Dow Jones-FXCM U.S. Dollar Index (Ticker: USDollar) is 0.3% lower on the day after falling back from a high of 9505.95, but the sharp pullback may gather pace over the next 24-hours of trading as the USD trades within a downward trending channel. However, should the relative strength index hold above 30, we may see the index hold near-term support around 9450.00, and a correction may unfold during the overnight trade, which could push the index towards the upper bound of its current range around 9500.00.
U.S._Dollar_Index_Searches_For_Support_Sterling_Weakness_Ahead_body_ScreenShot048.png, U.S. Dollar Index Searches For Support, Sterling Weakness Ahead
In light of the recent comments by Atlanta Fed President Dennis Lockhart, it seems as though the central bank is keeping the door open to expand monetary policy further should the risk for a double-dip recession materialize, but it seems as though the FOMC will preserve a wait-and-see approach throughout the remainder of the year as policy makers expect to see a resumption in growth. However, the slowing recovery could force the Fed to keep its exit strategy on hold for an extended period of time, and we may see Chairman Ben Bernanke endorse a zero interest rate policy throughout 2012 as the central bank aims to stimulate the ailing economy. As the dollar index continues to mark lower highs, it seems as though the we will see the downward trend carry into the following year, and the bearish sentiment underling the greenback may gather pace over the near-term as the central bank curbs its outlook for the world’s largest economy.
U.S._Dollar_Index_Searches_For_Support_Sterling_Weakness_Ahead_body_ScreenShot050.png, U.S. Dollar Index Searches For Support, Sterling Weakness Ahead
Two of the four components advanced against the greenback on Tuesday, led by a 0.19% rally in the British Pound, but the recent strength in the British Pound could be short-lived as the Bank of England maintains a dovish outlook for monetary policy. With the meeting minutes on tap for later tonight, the policy statement could highlight an increased risk of undershooting the 2% target for inflation, and the central bank may show a greater willingness to expand policy further in order to combat the slowing recovery in the U.K. Should we see a growing shift within the Monetary Policy Committee, speculation for a additional asset purchases is likely to spark a bearish reaction in the sterling, and the GBP/USD may give back the advance carried over from the previous week as interest rate expectations falter.

GBP/JPY Elliott wave count and Fibonacci levels for August 16, 2011

GBP/JPY is developing corrective wave B of medium term downtrend from 123.27 (colored magenta in the chart). Within this wave there are three subwaves (colored orange red in the chart) with subwave C still developing from 123.95.
The targets of the upmove are Fibonacci retracements of 130.81-123.27, 128.87-123.27, and expansions off 123.27-124.96-123.95, 123.95-125.61-124.96.
Resistances:
- 125.99 = contracted objective point (COP)
- 126.07-15 = confluence area of .50 and .382 retracements
- 126.62-68-73 = confluence area of objective point (OP), expanded objective point (XOP), and .618 ret
- 127.04 = .50 ret
- 127.65 = XOP
- 127.93 = .618 ret
- 128.37 = super expanded objective point (SXOP)
If the price reverses to the downside the targets of the downmove will be Fibonacci retracements of 123.27-125.99.
Supports:
- 124.95 = .382 ret
- 124.63 = .50 ret
- 124.31 = .618 ret
Overbought/Oversold
Assuming that the medium term trend is now down it's preferable to try short positions when the Detrended Oscillator gets above the zero level (10-15 pips above the current prices) or into the overbought area (45-65 pips above the current prices).

Monday, August 15, 2011

EUR/USD candlestick analysis (long-term view) 2011-08-15

The EUR/USD currency pair closed with a sharp decline this week.
Earlier in a weekly graph the EUR/USD formed Dark Cloud Cover candlestick combination indicating downside movement confirmed further.
This combination shows that the pair dropped sharply after an attempt to advance to the resistance level 1.4700, which means that the bears started to increase their influence.
Further decline is supported by the RSI indicator demonstrating a rollback from the overbought level 70.0.
Break of the support level 1.3969 will denote that this point of view is correct. In this case we should expect a decline to the support level 1.3427 where the Fibonacci correction level 50.0 is also located.
It is worth mentioning that stop loss should be placed slightly above the resistance level 1.4700 as its break will target the pair to 1.4900. 

Sunday, August 14, 2011

InstaForex – Best Broker in Asia 2011

InstaForex Company has been called the best broker of Asia triply

Worldwide known InstaForex Company has been awarded with the Best Broker in Asia title for the third time by the «World Finance Awards» launched by the British publication World Finance. Victory in this prestigious nomination comes as one more approval of the company’s positive development dynamics. The company’s management made the right choice selecting the Asian region for implementing its strategic ideas. Impressive InstaForex achievements in Asia prompted further development and creation of well-known brand which is in the limelight of Forex currency market as well as among the financial market members.

Presently, Asia involves the majority of direct sales offices and company’s divisions. In many of them educational courses and seminars are run on a permanent basis. Having carried out accurate market researches, InstaForex experts have hammered out additional services for the Asian traders. Aside from that, the second year straight a great interest of Forex society is fueled by a distinguished “Miss InstaForex Asia” contest. All this has become possible due to a competent management policy and well-skilled approach to each activity aspect.

Getting its work on the road, the company made a stake on high-grade services and their availability for traders with any capital. Amid this, its work standards are expanding permanently. To this day, InstaForex is one of the leaders of the Asian as well as of the global brokerage services market. The company offers maximally full range of trading instruments, wide choice of different options, various educational projects and unique bonus programs. In other words, InstaForex allows no matter a newcomer or a real Forex guru to find the most suitable terms of trading and extra opportunities. The broker always follows the latest trends, changes for the better and keeps on investing in people and technologies in order to meet expectations of traders around the globe. InstaForex turned out to be a reliable partner already for more than 350 thousands of traders from 80 countries. The number of representative branches also rises – expanding geographically the company advances the quality and efficiency of serving the international clients.

InstaForex team thanks the award organizer – the international financial magazine “World Finance” and every client for giving a high assessment of the company’s work. InstaForex hopes to solidify its positions in Asia and all over the world going forward for the benefit of its clients and extending its services line.
Sincerely,
Clients Service

Friday, August 12, 2011

GBP/JPY Elliott wave count and Fibonacci levels for August 12, 2011

GBP/JPY is developing wave C of medium term downtrend from 128.87 (colored red in the chart). Within this wave there are four subwaves with subwave 4 from 123.27 still developing (colored orange red in the chart). The targets of the upmove are Fibonacci retracements of 130.81-123.23, 128.87-123.27, 127.01-123.27, and expansions off 123.27-124.75-123.36.
Resistances:
- 125.14 = .50 retracement
- 125.41 = .382 ret
- 125.58 = .618 ret
- 125.75 = expanded objective point (XOP)
- 126.07-15 = .50 and .382 retracements
- 126.73 = .618 ret
- 127.04 = .50 ret
- 127.93 = .618 ret
If the price reverses to the downside the targets of the downmove will be Fibonacci expansions off 130.81-127.38-128.87, 128.87-125-36-127.01.
Supports:
- 121.33 = expanded objective point (XOP)
- 119.89 = super expanded objective point (SXOP)
Overbought/Oversold
Assuming that the medium term trend is now down it's preferable to try short positions when the Detrended Oscillator gets above the zero level (20-25 pips above the current prices) or into the overbought area (60-80 pips above the current prices).

Thursday, August 11, 2011

GBP/JPY Elliott wave count and Fibonacci levels for August 11, 2011

GBP/JPY is developing wave C of medium term downtrend from 128.87 (colored red in the chart). Within this wave there are four subwaves with subwave 4 from 123.27 still developing (colored orange red in the chart). The targets of the upmove are Fibonacci retracements of 130.81-123.23, 128.87-123.27.
Resistances:
- 125.41 = .382 retracement
- 126.07-15 = .50 and .382 retracements
- 126.73 = .618 ret
- 127.04 = .50 ret
- 127.93 = .618 ret
If the price reverses to the downside the targets of the downmove will be Fibonacci expansions off 130.81-127.38-128.87, 128.87-125-36-127.01.
Supports:
- 121.33 = expanded objective point (XOP)
- 119.89 = super expanded objective point (SXOP)
Overbought/Oversold
Assuming that the medium term trend is now down it's preferable to try short positions when the Detrended Oscillator gets above the zero level (current prices) or into the overbought area (40-60 pips above the current prices).

Wednesday, August 10, 2011

GBP/JPY Elliott wave count and Fibonacci levels for August 10, 2011

GBP/JPY is developing wave C of medium term downtrend from 128.87 (colored red in the chart). Within this wave there are three subwaves with subwave C from 127.01 still developing (colored orange red in the chart). The targets of the downmove are Fibonacci expansions off 130.81-127.38-128.87, 128.87-125-36-127.01, 127.01-124.48-126.22.
Supports:
- 123.69 = objective point (OP)
- 123.50 = OP
- 123.32 = expanded objective point (XOP)
- 122.13 = XOP
If the price reverses to the upside the immediate resistances will be Fibonacci retracements of 130.81-124.48.
Resistances:
- 126.90 = .382 retracement
- 127.65 = .50 ret
- 128.39 = .618 ret
Overbought/Oversold
Assuming that the medium term trend is now down it's preferable to try short positions when the Detrended Oscillator gets above the zero level (15-20 pips above the current prices) or into the overbought area (40-60 pips above the current prices).

Tuesday, August 9, 2011

USD/JPY Intraday Technical analysis 2011-08-09

The spot rate approaches the intermediate resistance of its medium term bearish channel in 78.50. A break of these levels would allow it to reach the upper limit of this one to 80.20.
According to previous events, the market indicates a bullish opportunity as soon as the spot rate will have broken its resistance in 78.50 with a 1st objective of 79.20, then 79.50. A break in 78.20 would invalidate this scenario

Monday, August 8, 2011

EUR/USD. Weekly and Monthly Pivot Points, For 08 - 12/ August, 2011

____WEEKLY_____
Weekly - R3 = 1.4868
Weekly - R2 = 1.4660
Weekly - R1 = 1.4470
Weekly Pivot = 1.4262
Weekly - S1 = 1.4072
Weekly - S2 = 1.3864
Weekly - S3 = 1.3674
____MONTHLY______
Monthly - R3 = 1.5447
Monthly - R2 = 1.5013
Monthly - R1 = 1.4705
Monthly Pivot = 1.4271
Monthly - S1 = 1.3963
Monthly - S2 = 1.3529
Monthly - S3 = 1.3221

Friday, August 5, 2011

EUR/GBP candlestick analysis for August 5, 2011

In a 4-hour graph the EUR/GBP currency pair has successfully tested the support level 0.8720, to continue downside movement further.
Earlier in a 4-hour graph the EUR/GBP formed a Dark Cloud Cover candlestick combination indicating downside movement confirmed further.
This candlestick combination was demonstrating strong upside movement after a fail to break 0.8720. However, it reversed near 0.9083. It means that the bears activated near 0.9100 and did not allow the bulls to fixate.
Fixation below the Fibonacci correction level 23.6 denotes that this point of view is correct. This caused a decline to the support level 0.8860 where the Fibonacci correction level 61.8 is located as well. Its break caused downside movement to 0.8720. If it fixates below 0.8720, it will allow the pair to reach 0.8600.
It is worth mentioning that stop loss should be placed slightly above the resistance level 0.8891 as its break will target the pair to 0.9000.